I use social media ads like Meta, TikTok, and Pinterest ads to drive traffic to my eCommerce website.
The clicks looked amazing. My ad dashboard showed thousands of visitors hitting my WooCommerce store. I thought I’d cracked the code.
Then I checked my sales. Almost nothing.
That’s when I discovered cart abandonment tracking. Turns out, 85% of my ad traffic was adding products to cart and then disappearing. My ads weren’t the problem. My traffic quality was terrible.
Once I started tracking cart abandonment alongside my traffic and ad campaigns, everything changed.
I could finally see which platforms sent real buyers versus window shoppers. As a result, I cut my ad spend in half and tripled my revenue.
Today, I will show you how to track cart abandonment through the manual setup of Google Analytics 4 and a simple plugin method that takes minutes to set up.
This way, you can choose the method best for your needs.
What You’ll Learn:
- What cart abandonment is and why it validates your ad spend
- How to track it manually with Google Analytics 4 (the technical way)
- Easy way to track it automatically with MonsterInsights (the effortless way)
- How to connect abandonment data to your TikTok and Pinterest campaigns
- What to do with the data to improve your ROI
What Is Cart Abandonment?
Cart abandonment occurs when customers add products to their shopping cart but fail to complete the purchase.
The process looks like this:
- A customer browses your products.
- They find something they want and click “Add to Cart.”
- The item sits in their cart.
- They might even start the checkout process by entering their email or shipping address.
- Then they leave. No purchase. No explanation.
Industry research shows 70% of all shopping carts get abandoned. That means for every 10 people who add items to cart, only 3 actually complete their purchase.
Think about what that means for your business. If your average order value is $100, and 7 out of 10 customers abandon their carts, you’re potentially losing $700 for every $300 you make.
Why This Matters More Than You Think
Most store owners focus on recovering abandoned carts. They set up email sequences to bring people back.
That’s helpful. But it misses the bigger picture.
Cart abandonment data tells you something critical about your traffic quality. High abandonment from a specific traffic source means those visitors aren’t actually ready to buy.
Your ad campaigns might send thousands of visitors to your site. But if 90% of those visitors abandon their carts, something is fundamentally wrong with your targeting.
Low abandonment rates indicate quality traffic. These visitors match your customer profile and have genuine purchase intent.
What You’ll Need Before Starting
Before we dive into cart abandonment tracking setup, let’s make sure you have everything ready. Getting these pieces in place first will save you headaches later.
For the GA4 Method (Manual Tracking)
- You’ll need a Google Analytics 4 account already connected to your WordPress site. If you haven’t set this up yet, check out my guide on setting up Google Analytics.
- Apart from that, you need a WooCommerce store with active products. The tracking won’t work without an eCommerce platform installed.
- Check out my tutorial on how to set up a profitable online store if you need help here.
- On top of that, you’ll need some technical comfort. You’ll be working inside Google Analytics, creating funnels and setting up dimensions.
Plan for 30-45 minutes of setup time. The Google Analytics 4 (GA4) method involves building custom reports and configuring multiple settings.
For the MonsterInsights Method (Automatic Tracking)
- You’ll need MonsterInsights Pro. The free version doesn’t include the eCommerce addon required for cart abandonment tracking.
- Your WooCommerce store needs to be installed and active. MonsterInsights works with other platforms, too, like Easy Digital Downloads, but WooCommerce is the most common.
- You need WordPress admin access to install plugins and change settings.
The best part? Setup takes about 5 minutes. Zero technical knowledge required.
With that said, let us begin!
How to Track Cart Abandonment Rates (With and Without a Plugin)
The GA4 method is free but complex. It’s good if you’re technically minded and don’t mind maintaining manual reports.
The MonsterInsights method is paid but effortless. Perfect for beginners who want automatic tracking without touching Google Analytics.
I’ll show you the GA4 way first so you understand exactly what’s involved. Then you’ll see why MonsterInsights compares with its simple solution.
Here is a Table of Contents you can use to navigate to any method you want to use.
- The Manual Way – Track Cart Abandonment with GA4
- The Easy Way – Track Cart Abandonment with MonsterInsights
- Reading Your MonsterInsights Cart Abandonment Reports
- Connecting Cart Abandonment to Your Traffic Quality and Ad Campaigns
- Tips to Improve Ad Quality and Reduce Cart Abandonment
- FAQs: How to Track Cart Abandonment Rates (With and Without a Plugin)
- Final Verdict – Should You Track Cart Abandonment?
Plus, if you’ve already followed our tutorials on tracking TikTok ads and Pinterest ads with MonsterInsights, you’re already 80% there. You just need to enable one additional setting.
The Manual Way – Track Cart Abandonment with GA4
⚠️ This section gets technical fast. If you want the easy method that just works, skip ahead to the MonsterInsights section below.
But I recommend reading this first so you understand exactly what you’re avoiding. Google Analytics 4 can track cart abandonment, but only by building custom reports from scratch.
Walking through this manual process shows you what MonsterInsights automates behind the scenes – and why that automation is worth it.
I will assume that you already set up Google Analytics 4 using my guide and jump straight to the steps for setting up cart abandonment.
Step 1: Enable Enhanced Measurement (Optional)
Even though this is an optional step, it allows you to automatically track common user interactions on your website without needing extra code or Google Tag Manager setup.
This will help you quickly track events like page views, scroll metrics, outbound links, video engagement, and more.
This feature also allows you to automatically track your cart abandon rate from your Google Analytics dashboard.
So, how do you actually automatically enhance eCommerce measurements in GA 4?
First, you need to turn on eCommerce tracking in your Google Analytics 4 account. To do this, log into your Google Analytics account and click the Admin gear icon in the bottom left corner.
Then, under the Property Settings column, click “Data Streams” to see a list of your connected websites.
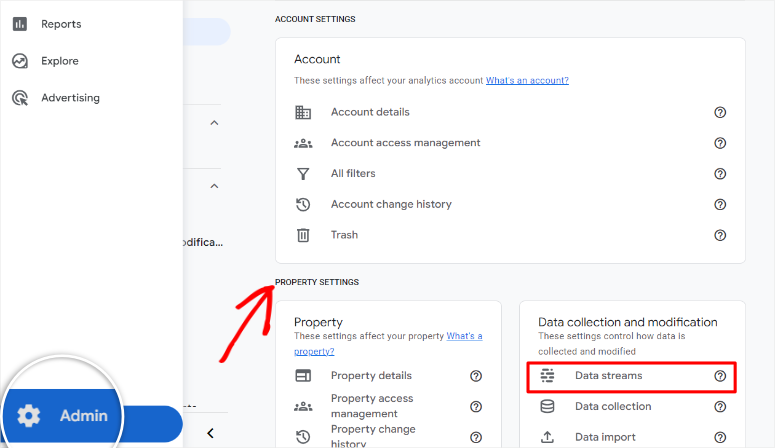
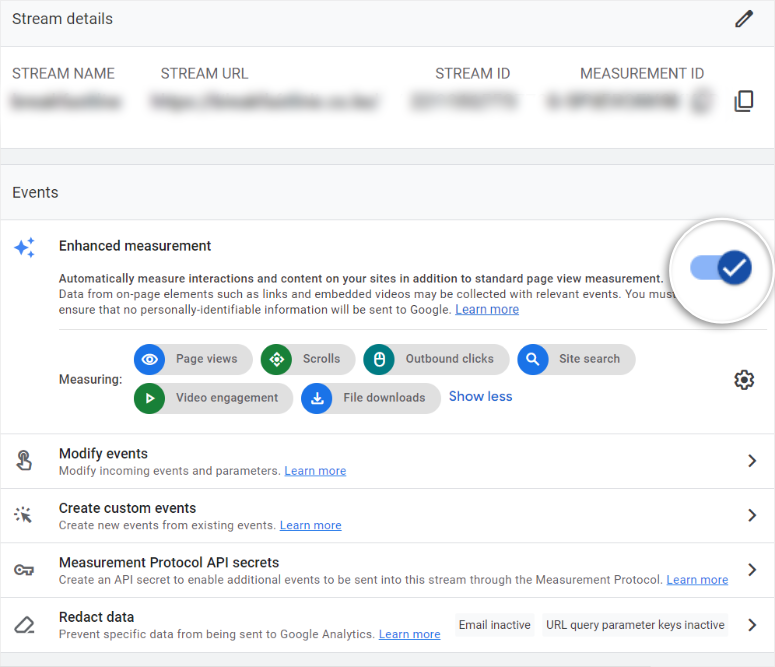
After this, select your website stream to open the settings and scroll down to the “Enhanced measurement” section.
Make sure this toggle is turned ON. It should show blue when enabled.
Then, click the settings gear icon next to Enhanced Measurement to see what events are being tracked automatically. Look for these specific events:
- Page views
- Scrolls
- Outbound clicks
- Site search
- Video engagement
- File downloads
Once you enable this function with the toggle bar, these should all be on by default. If any are off, toggle them on.
Check out this full guide on how to set up Enhanced Measurement in Google Analytics 4.
Step 2: Track Cart Abandonment Manually
Log in to your GA4 account. Then, on the left-hand menu, hit Explore.
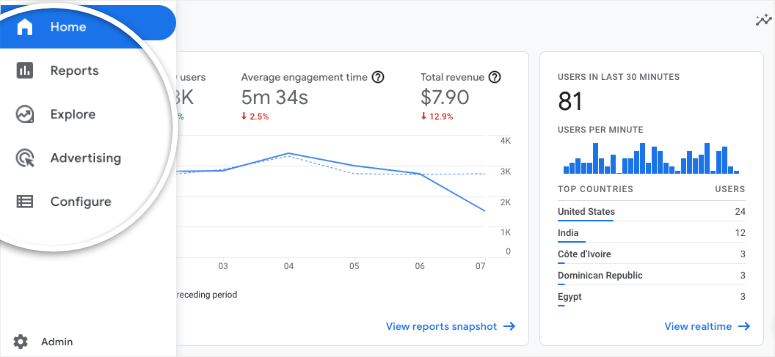
On the next screen, you will see funnel templates like Free Form, Funnel Exploration, and Path Exploration.
But in our case, we want to make a custom funnel to track cart abandonment. To do this, we will select the “Blank” template.

After this, under Exploration Name, give your funnel a name that makes sense to you; something like “Abandoned Cart” works great.
Next, go to the “Settings” tab and go to Technique. Here, pick Funnel Exploration from the dropdown menu.
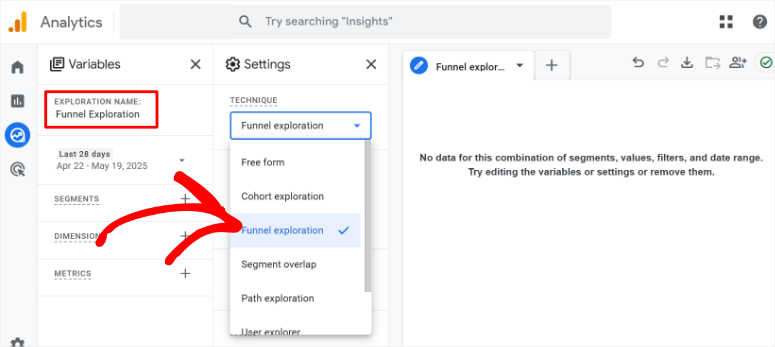
Then, select the pencil icon next to Steps to open the funnel settings. This is the place where you will add the steps for your funnel.
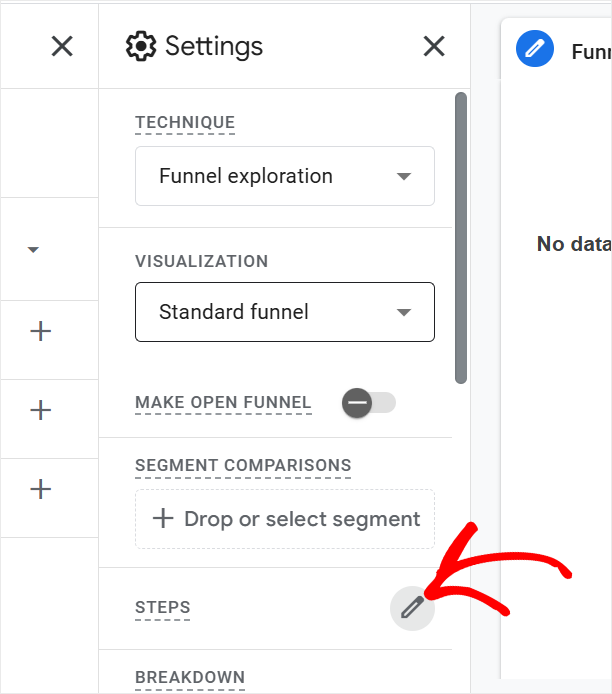
Remember, they need to be logical, mimicking the user journey from when a user lands on your site until they make a purchase.
This allows you to see the drop-off at any stage, and most importantly, understand cart abandonment.
So, with that in mind, name ” Step 1″ something like “View Item.” Then, under the Add new condition dropdown, select “view_item.”
Can’t see it? No worries, you can create a custom event with the name “view_item.” After this, select the Add Step button to move to the next step.
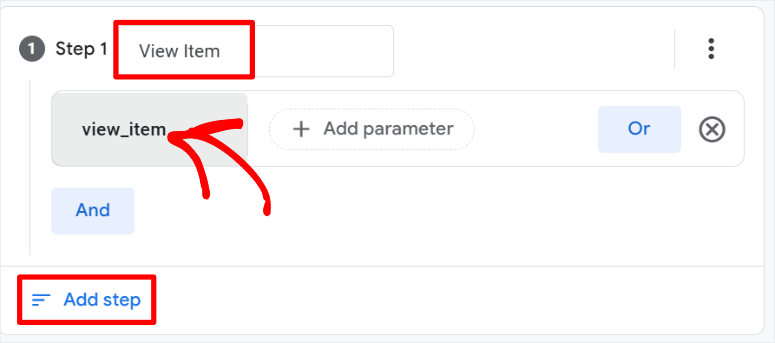
After this, you will repeat Step 1 to add all the steps for your funnel. So in our case, we created:
- Step 2: Name it “Add to Cart.” Then, in the Add New Condition dropdown, select or create “add_to_cart.”
- Step 3: Go with “Begin Checkout.”Then, in the Add New Condition dropdown, select or create “begin_checkout.”
- Step 4 should be named “Purchase.”Then, in the Add New Condition dropdown, select or create “purchase.”
In the end, your funnel steps should look like my sample below. All that you have to do now is select Apply.
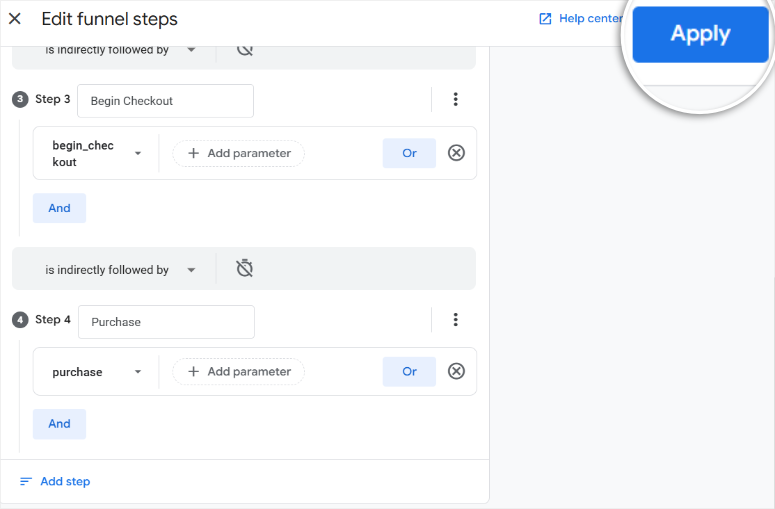
That’s it! You’ve now created a custom funnel to help you manually track cart abandonment inside GA4.
Analyze Cart Abandonment Data in Google Analytics 4
This funnel will show you exactly where people are dropping off, whether they view a product, add it to their cart, but never make it to checkout or purchase.
It’s a fantastic way to get a clear picture of your abandoned cart stats and spot where you might need to improve your checkout experience.
The funnel visualization in GA4 will clearly show how many users progress through each step, from adding products to the cart, starting the checkout process, and ultimately completing a purchase.
With the funnels, you can track:
- Each funnel step and the percentage of users who reached this step.
- The actual number of users who reached each step
- Completion rate
- Abandonment rate
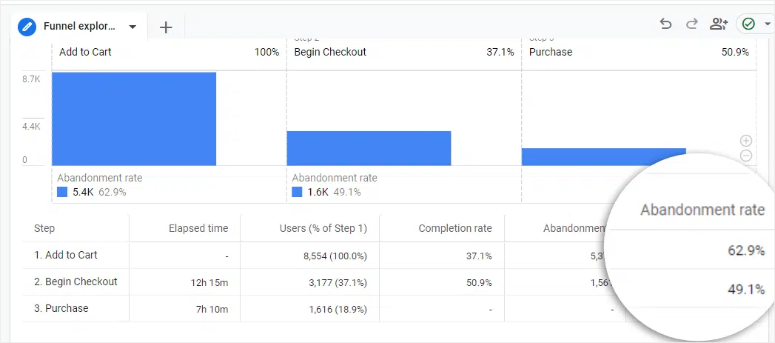
There you have it! You can now set up cart abandonment funnels both manually and using this analytics plugin. The next question is how you use this data.
The Reality of Manual GA4 Setup
As you can see, learning GA4’s Explore section takes 3-5 hours for most beginners. Then, building your first funnel takes another 30-45 minutes.
After that, you’ll spend 10-15 minutes daily checking reports manually – forever. Your reports don’t live in WordPress, there’s no automatic alerting, and product-level insights require advanced knowledge.
Plus, correlating abandonment with traffic and ad campaigns means building additional custom reports. This isn’t set-it-and-forget-it tracking.
The biggest issue is that you’re building reports manually instead of getting pre-built dashboards that just work.
This is exactly what MonsterInsights solves. Let me show you the difference.
The Easy Way – Track Cart Abandonment with MonsterInsights

MonsterInsights makes cart abandonment tracking completely automatic.
No funnel building, manual report configuration, or switching between WordPress and Google Analytics. Everything just works from the moment you activate it.
MonsterInsights creates pre-built cart abandonment reports that appear directly in your WordPress dashboard.
This statistics plugin tracks every add-to-cart action, checkout initiation, and purchase automatically. You don’t configure events or set up funnels manually.
On top of that, you get product-level abandonment data without additional setup. The reports show exactly which items customers abandon most often.
Apart from that, date-based analysis happens automatically. You can see abandonment patterns by day, week, or month without building custom reports.
Here’s the comparison:
| GA4 Method | MonsterInsights Method |
|---|---|
| 3-5 hours learning curve | 5 minutes total setup |
| Build reports manually | Pre-built reports included |
| Check GA4 daily | Check WordPress dashboard |
| No automatic alerts | Weekly email reports |
| Product data needs advanced skills | Product data automatic |
With that said, let me walk you through the steps of setting up cart abandonment with MonsterInsights.
Step 1: Getting MonsterInsights
MonsterInsights comes in two versions: free and Pro.
The free version of MonsterInsights is great for basic Google Analytics tracking. You can easily access it in your plugin repository in your WordPress dashboard.
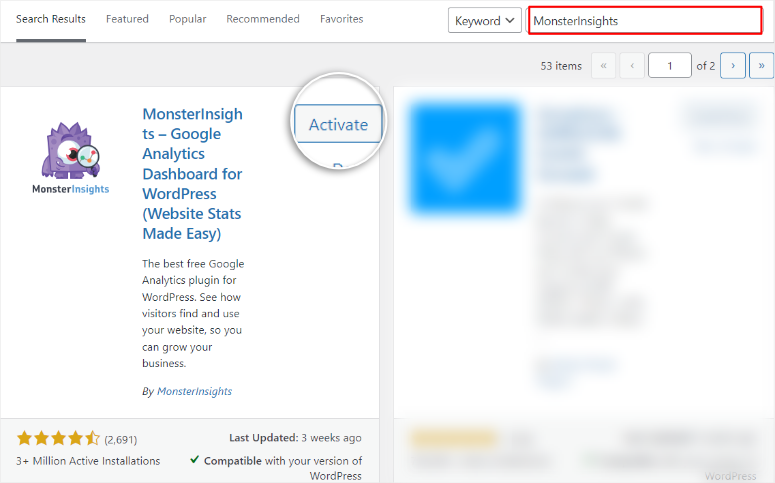
But for cart abandonment and ecommerce tracking, you need MonsterInsights Pro. The paid version includes the eCommerce addon you need for cart abandonment reports.
So, how do you set up the paid version of MonsterInsights?
Head over to MonsterInsights.com and purchase a plan.
Once you’ve completed the purchase, go to your monsterInsights account and select the Download Tab. Here, download the ZIP file to your PC. While here, copy the license key; you will need it later.
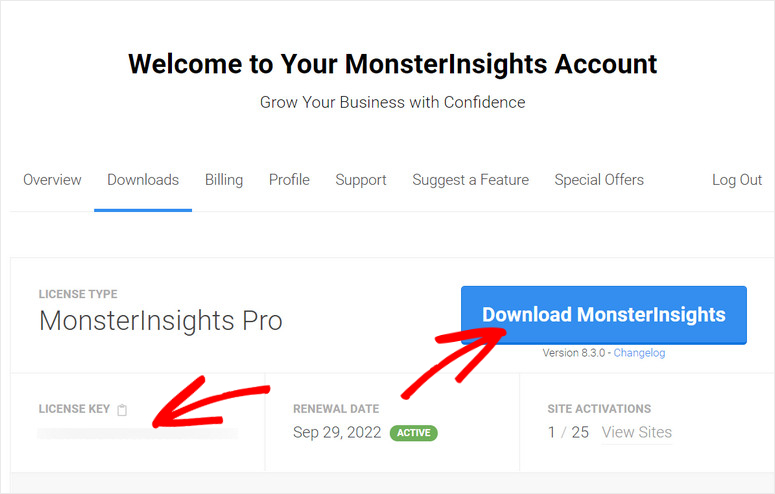
Once done, head over to your WordPress dashboard and go to Plugins » Add New. On this screen, select the Upload Plugin button.
Then, upload the MonsterInsights Pro plugin file you downloaded earlier, install it, and select Activate.
If you face any issues, follow this guide on how to install a plugin for more information.
After activation, You should see a new menu option in your WordPress dashboard labeled “Insights,” indicating the installation was a success.
Next, go to Insights » Settings and navigate to the “General” tab. Here, paste the code you copied earlier in the text box provided and hit “Verify.”
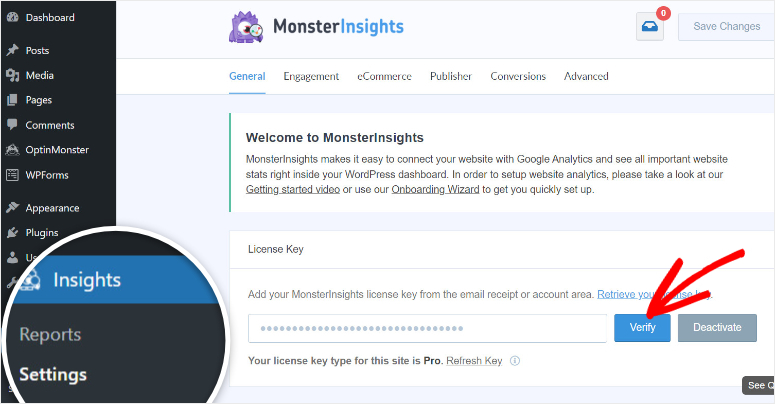
That is it! You are now ready to connect MonsterInsights to your Google Analytics 4 account.
Step 2: Connect Your Website to Google Analytics
To connect GA 4 we will use the MonsterInsights set up wizard which is found on the same page as the verification text bar. That is, Insights » Settings » General.
Once you verify MonsterInsights, scroll down the page and select Launch Setup Wizard to open the first screen of the setup process.

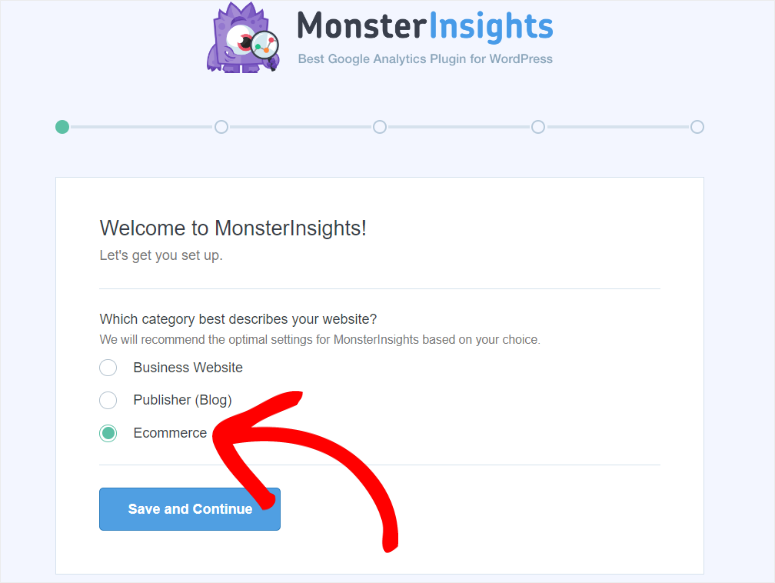
The first screen will ask you to select the type of website you’re running. Use the checkboxes to select between Business Website, Blog, or eCommerce.
Since we are setting up cart abandonment tracking, choose eCommerce to ensure the right settings are applied.
After this, hit Save and Continue to move to the next page of the installation wizard.
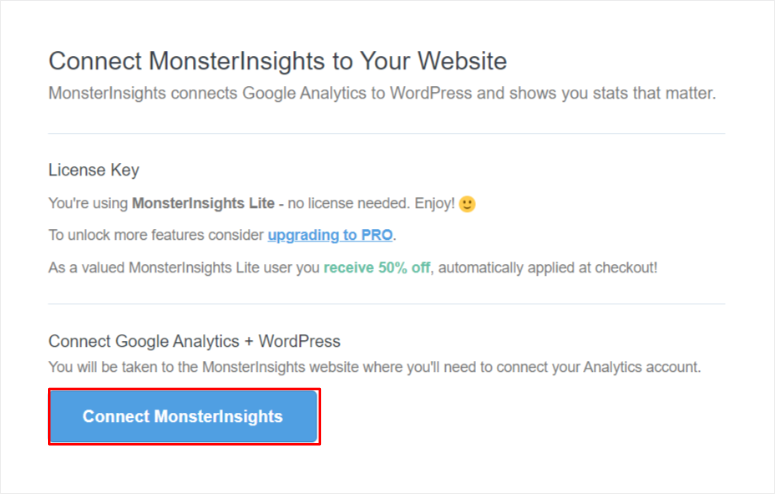
Then, on the next screen, you’ll be prompted to sign in with your Google account.
Remember when I mentioned having both your Google Analytics account and WordPress dashboard open in the same Window? This is where it comes in handy.
So, with that done, hit “Connect MonsterInsights.”
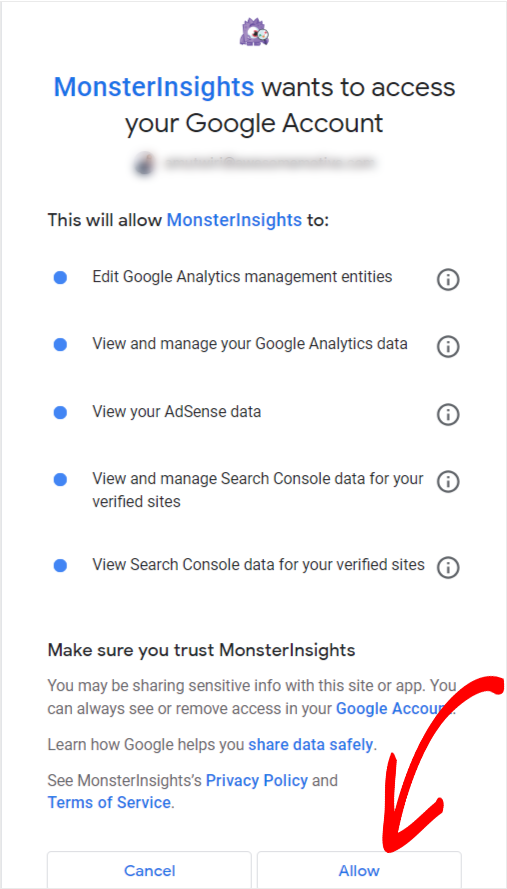
After logging into Google, you’ll see a list of all your Google accounts logged in. Select the Google Account you used to create Google Analytics 4.
Then, on the next page, select Allow to grant MonsterInsights access to your Google Analytics account.
After the connection is successful, you will be redirected back to your WordPress dashboard to continue the setup process with the wizard.
On this page, you will see the recommended settings, like event tracking, file download tracking, and enhanced link attribution. It’s best to leave these on unless you have special requirements.
While on this page, also make sure that eCommerce tracking is on to ensure all the metrics are sent to your WordPress dashboard.
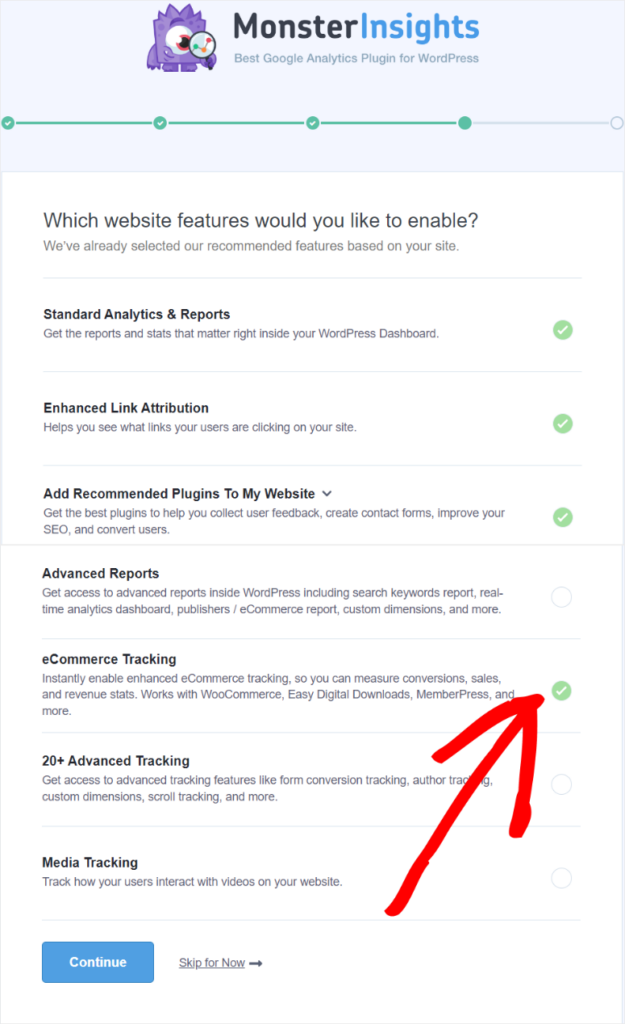
Finally, hit Continue to complete the GA4 connection. It is that simple, no need to touch any code or dig into complex Google Analytics settings!
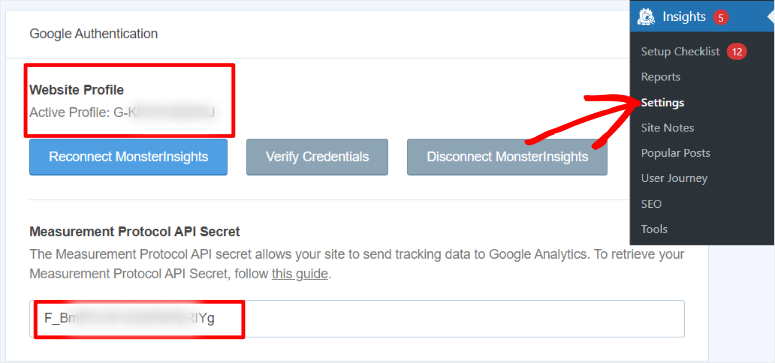
To confirm if you have actually connected Google Analytics to WordPress, head to Insights » Settings and proceed to the General tab.
Find the “Google Authentication” section, where you will see your Google ID and Measurement Protocol API from your Google Analytics account already placed by MonsterInsights.
Now, let us set up eCommerce tracking in MonsterInsights.
Step 3: Install the eCommerce Addon
After connecting your site to GA4, the next important step is to install the eCommerce Addon inside MonsterInsights to help you gather cart abandonment statistics.
This addon unlocks the ability to track specific WooCommerce activities, such as product views, add-to-cart events, checkout steps, and completed purchases.
To set this up, head to your WordPress dashboard and choose Insights » Addons. Then, browse through the available addons until you find the one called “eCommerce.”
Once you locate it, select Install, and then “Activate.”

That’s it! Once the addon is activated, MonsterInsights will automatically start tracking your eCommerce data, without any extra setup or code.
But remember!
Cart abandonment reports need 24-48 hours to populate with initial data.
This waiting period is normal. Google Analytics processes data with built-in delays, and MonsterInsights displays that processed data in WordPress.
That’s It. You’re Done!
It takes you about 5 minutes to set up cart abandonment with MonsterInsights. Toggle one setting. Install one addon. Done.
Reading Your MonsterInsights Cart Abandonment Reports
Now, let’s look at where your cart abandonment data lives and how to interpret what you see.
This is where MonsterInsights’ new cart abandonment feature really shines. You get clear, actionable insights without digging through complex Google Analytics reports.
Where to Find Your Abandonment Data
Navigate to Insights » Reports » eCommerce in your WordPress dashboard.
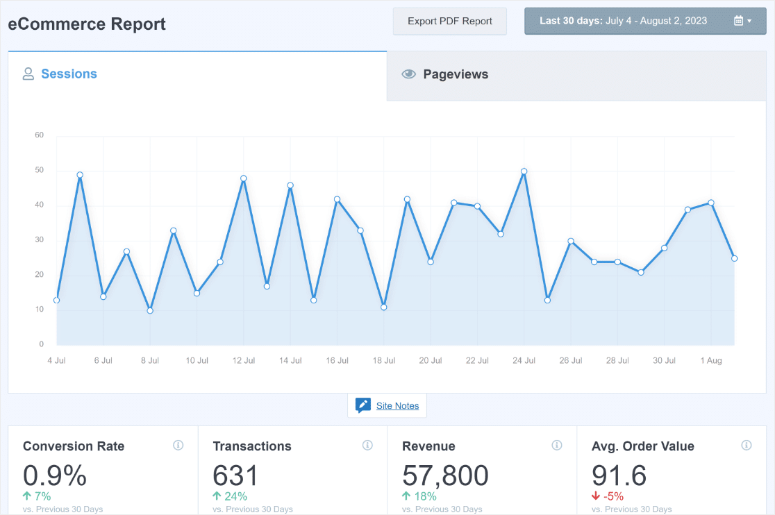
You’ll see several tabs at the top of the page. Click on “Overview” first to see your general ecommerce performance.
Then click the “Cart Abandonment” tab. This is MonsterInsights’ newest reporting feature, designed specifically to help you see and save your lost revenue.
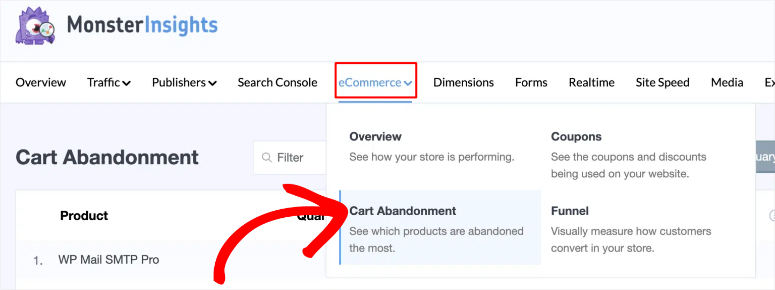
As you can see below, MonsterInsights organizes your data into clear, visual sections that tell the complete story of what’s happening with your abandoned carts.
Understanding the Overview Stats – Now See product level Reports
In the past, you could only see overall cart abandonment rates in MonsterInsights. There was no easy way to know which specific products customers were abandoning or when those abandonments happened.
As a result, you’d see a general percentage, but identifying problem products required building complex custom reports in GA4 that most beginners couldn’t figure out.
Now, MonsterInsights’ updated Cart Abandonment feature changes everything.
The Cart Abandonment report displays a detailed table showing exactly which products customers abandon and where they drop off in the buying process.
This product-level visibility was previously impossible without advanced GA4 knowledge. Now it is all automatic.
MonsterInsights organizes the data into five key columns:
- Product lists each item in your store individually, so you can see performance at the product level.
- Quantity shows how many units of each product were added to carts but never purchased during the selected time period.
- Revenue displays the total dollar value of potential sales sitting in abandoned carts for each product. This helps you prioritize which items need attention first.
- Cart Abandonment Rate shows the percentage of people who added this item to their cart but didn’t proceed to checkout.
- High rates here indicate issues on the product page itself – unclear descriptions, missing information, or pricing concerns.
- Checkout Abandonment Rate shows the percentage of people who started checkout with this item but didn’t complete payment.
- High rates here point to checkout process problems like unexpected shipping costs or complicated payment forms.
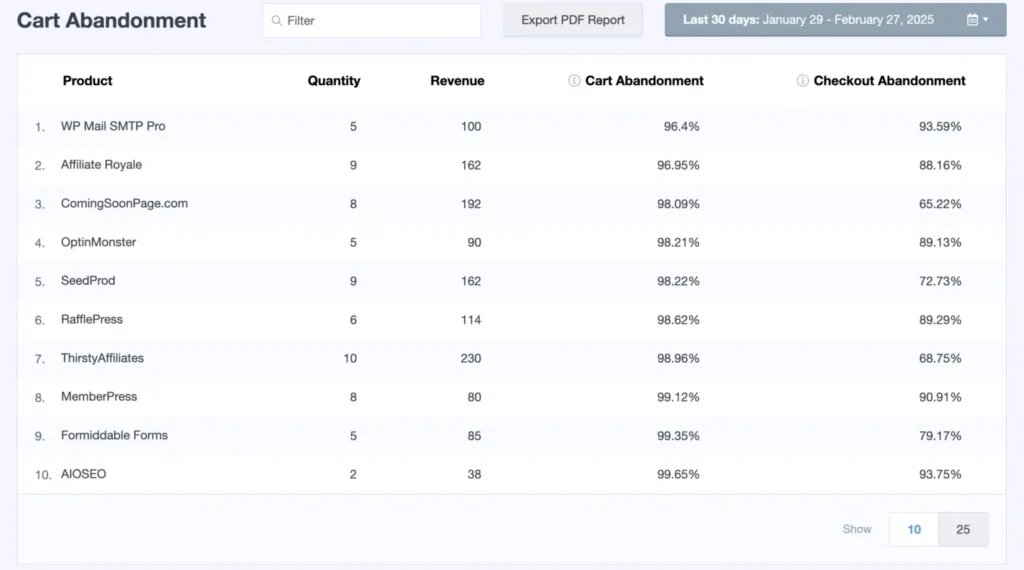
So what do these numbers actually mean?
Cart Abandonment Rate:
- Over 80% = major product page issues need fixing
- 70% or higher = industry average (room for improvement)
- 50-70% = better than most stores
- Under 50% = excellent product page performance
Checkout Abandonment Rate:
- Over 60% = serious checkout problems (surprise fees, complex forms)
- 40% or higher = checkout process needs optimization
- 20-40% = typical performance
- Under 20% = smooth checkout experience
The combination of these two rates tells you exactly where customers drop off, so you know whether to fix your product pages or your checkout process.
Connecting Cart Abandonment to Your Traffic Quality and Ad Campaigns
This is where everything comes together. You’ve tracked your Facebook traffic. And also your TikTok, Pinterest ad traffic. Now you’ll see which campaigns send quality buyers versus window shoppers.
Getting clicks is easy. Getting quality clicks is hard.
Cart abandonment data reveals your true traffic quality. High click numbers mean nothing if those visitors abandon their carts at 90%.
Low abandonment rates, on the other hand, prove you’re attracting the right audience – people who came ready to buy, not just browse.
The Complete Traffic Quality Picture
Your ad tracking shows you clicks, sessions, and initial conversions. Those metrics look great on paper.
But cart abandonment data reveals what’s really happening after people click your ads. High abandonment from a specific campaign means your targeting is off. You’re attracting browsers, not buyers.
Low abandonment from a campaign means you’ve found the perfect audience match. These people came ready to purchase.
This connection between ad performance and abandonment rates is critical for smart budget decisions.
Why You Need Both Metrics Together
Even the best ad tracking done alone shows only surface-level performance. You see clicks and basic conversions.
Cart abandonment tracking reveals traffic quality. You see how engaged visitors actually are. Together, these metrics give you complete conversion funnel visibility.
Note ⚠️: If you followed our recent tutorials on tracking TikTok ads and Pinterest ads with MonsterInsights, this is where everything comes together.
You’ll see which campaigns actually drive sales, not just traffic.
How to Analyze Your Campaign Quality
MonsterInsights makes this connection automatic. Your cart abandonment data lives in the same dashboard as your campaign tracking data.
Here’s how to review the complete picture:
Step 1: Check Your Ad Campaign Performance
Navigate to Insights » Reports » Traffic » Campaigns in your WordPress dashboard. Here, review your TikTok campaign metrics. Note the sessions, users, conversions, and revenue.
Do the same and review your Pinterest campaign metrics. Look at the same numbers.
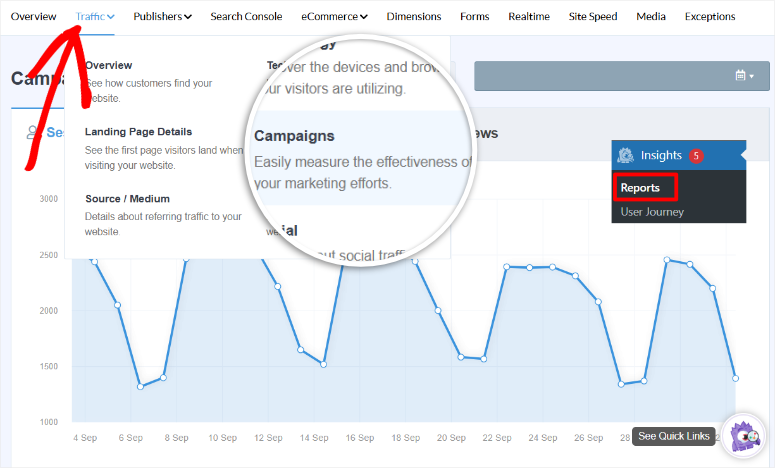
Write down these key numbers:
- Total sessions from each campaign
- Conversion rate
- Revenue generated
Step 2: Review Abandonment Patterns
Now go to Insights » Reports » eCommerce » Cart Abandonment.
Look at the “Abandonment by Date” table. You can find this feature next to the Export PDF Report in your MonsterInsights dashboard.
Note your overall abandonment rate during the periods when each campaign was running.
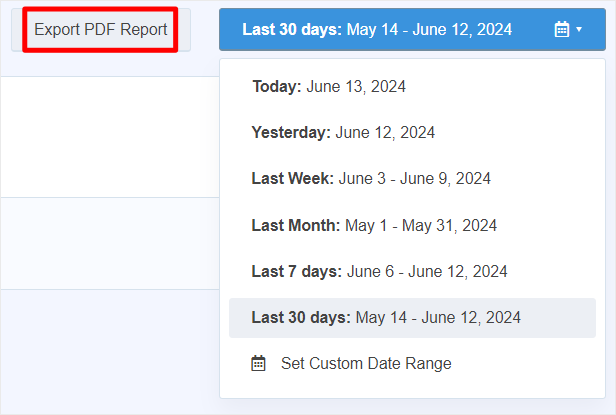
While MonsterInsights doesn’t automatically filter abandonment by traffic source in the main report, you can compare overall abandonment trends with your campaign launch dates.
- Did abandonment spike when your TikTok campaign launched? That indicates low-quality traffic.
- Did abandonment drop when your Pinterest campaign started? That signals high-quality, ready-to-buy visitors.
Step 3: Calculate True Campaign ROI
Here’s where the real insights appear.
Don’t just look at cost per click. Calculate cost per quality visitor who actually engages with your products.
Example Calculation:
TikTok Campaign:
- Ad spend: $500
- Visitors sent: 1,000
- Abandonment rate during campaign: 80%
- Quality visitors (those who didn’t abandon): 200
- True cost: $500 ÷ 200 = $2.50 per quality visitor
Pinterest Campaign:
- Ad spend: $300
- Visitors sent: 400
- Abandonment rate during campaign: 35%
- Quality visitors: 260
- True cost: $300 ÷ 260 = $1.15 per quality visitor
Tips to Improve Ad Quality and Reduce Cart Abandonment
Now that you understand your abandonment data, here’s exactly what to do with it.
As explained, your cart abandonment rates reveal your traffic quality – high abandonment means poor targeting, low abandonment means you’ve found the right audience.
When High Abandonment Shows Poor Traffic Quality
Refine Your Ad Targeting:
- Narrow your audience from broad to specific. Instead of “everyone interested in fitness,” target “women 25-34 who buy yoga equipment”
- Match your ad creative to your landing page. False expectations from misleading ads cause instant abandonment
- Test different audience segments to find buyers, not browsers
- Write detailed descriptions focusing on benefits, not just features. Answer “What’s in it for me?”
- Include 5-7 high-quality photos from different angles so people can see exactly what they’re buying
- Display customer reviews prominently. Social proof reduces purchase hesitation
- Show shipping costs early in the process. Surprise fees at checkout kill conversions
Optimize Your Checkout Process:
- Test your checkout on mobile devices. Most TikTok and Pinterest traffic comes from phones
- Remove unnecessary form fields. Only ask for essential information needed to complete the purchase
- Add security badges near payment buttons. Visible trust signals reduce abandonment fears
When Low Abandonment Confirms Quality Traffic
Scale Your Winning Campaigns:
- Increase daily budget by 20-30% for campaigns with abandonment rates under 50%
- Create lookalike audiences based on these converters to find more people like your best customers
- Document what’s working: targeting parameters, ad creative style, and landing page format. Then, replicate this success.
The Complete Picture
Ad tracking shows which campaigns drive traffic to your site. Cart abandonment tracking reveals the quality of that traffic.
Together, these metrics give you the complete conversion funnel visibility you need to make smart budget decisions.
Well done! You now understand how to track cart abandonment with Google Analytics 4 and also automatically with MonsterInsights.
Plus, you understand the connection between your ad performance and cart abandonment. If anything is unclear, check out the commonly asked questions below.
FAQs: How to Track Cart Abandonment Rates (With and Without a Plugin)
Do I need MonsterInsights Pro to track cart abandonment, or will the free version work?
No, you need MonsterInsights Pro for cart abandonment tracking. The free version doesn’t include the eCommerce addon required for abandonment reports.
The pro plan includes addons for eCommerce tracking, PPC tracking for ads, and cart abandonment reports.
How long until I see Google Analytics 4 data in my reports?
Allow 24-48 hours after setup for initial data to appear. This is normal because Google Analytics processes data with built-in delays.
MonsterInsights displays that processed information in your WordPress dashboard. Real-time reports show some data faster, but complete cart abandonment reports need the full waiting period.
Can I track other ad platforms besides TikTok and Pinterest?
Yes. MonsterInsights Pro supports Google Ads, Facebook Ads, Instagram Ads, and Bing Ads through the same PPC Tracking addon.
You can track unlimited campaigns across all these platforms at the same time from one WordPress dashboard. The cart abandonment connection works the same way for any traffic source.
Will this slow down my website?
No. MonsterInsights loads tracking codes asynchronously, meaning they don’t block your page from loading.
The analytics plugin is optimized for performance and won’t impact your site speed noticeably. As a result, thousands of high-traffic stores use MonsterInsights without performance issues.
What if I use a different eCommerce platform instead of WooCommerce?
MonsterInsights automatically integrates with WooCommerce, Easy Digital Downloads, MemberPress, LifterLMS, Content Pro, GiveWP, MemberMouse, Charitable, and WishList Member.
If you use one of these platforms, cart abandonment tracking works without additional configuration. The setup process is identical.
Can I track cart abandonment without any plugin at all?
Yes, using Google Analytics 4 directly. But this requires technical knowledge, manual report building, and constant monitoring.
For most beginners, the time saved with MonsterInsights justifies the investment. You get pre-built reports, automatic tracking, and WordPress dashboard integration.
How do I know if high abandonment is my fault or my ad targeting’s fault?
Compare abandonment rates across different traffic sources. If organic traffic has 40% abandonment but TikTok traffic has 85% abandonment, the problem is ad targeting.
If abandonment is consistently high across all sources, focus on improving your checkout process and creating better product pages.
What is online shopping cart abandonment?
Online shopping cart abandonment happens when customers add items to their cart but exit the website before purchasing. It’s a frequent eCommerce issue, often due to high shipping costs, a lengthy checkout, or distractions. But you can reduce it by simplifying the purchase process and addressing customer concerns to boost conversions.
How can I track shopping cart abandonment in Google Analytics?
You can automatically track shopping cart abandonment in Google Analytics by enabling Enhanced eCommerce tracking. Use the Checkout Behavior report to see where customers abandon their carts. You can also track shopping cart abandonment manually by setting up funnels. This allows you to monitor drop-off points, then optimize those stages to improve completion rates and revenue.
What is the average cart abandonment rate for eCommerce sites?
According to Baymard Institute, the average cart abandonment rate for eCommerce sites is approximately 70%, though it varies by industry. The general price of an industry’s products primarily determines the cart abandonment rate. For example, most fashion items are priced lower, so the abandonment rate is lower, while electronics, which are often priced higher, have a higher abandonment rate. But regardless of your industry, reducing this rate involves offering clear pricing, fast load times, and better checkout options.
Final Verdict – Should You Track Cart Abandonment?
Absolutely yes.
Without cart abandonment tracking, you’re flying blind with your sales process. You won’t know which campaigns send quality buyers versus which ones waste money on window shoppers.
Remember, cart abandonment tracking isn’t just about recovering lost sales. It validates your entire marketing strategy.
Plus, it can help you see which ad campaigns send real buyers so you can identify products that need optimization and make data-driven budget decisions.
Most importantly, it helps you stop wasting money on the wrong audiences so that you can scale what actually works.
Now that you’ve set up cart abandonment tracking, take your analytics to the next level with these comprehensive guides:
Essential Tracking Setup:
- Best tools to track visitor traffic on your WordPress site – Discover the top analytics tools beyond just cart abandonment for complete visitor insights
- How to set up user tracking in WordPress – Learn to track individual user behavior patterns across your entire site
Advanced Analytics Configuration:
- OnePageGA review: Simplify your Google Analytics – See if this tool makes viewing your analytics even easier than MonsterInsights
- How to set up Google Analytics goals – Configure specific conversion goals to complement your abandonment tracking
Campaign and Link Tracking:
- How to create UTM codes to track URLs – Build proper tracking parameters for all your marketing campaigns
- How to track affiliate links in Google Analytics – Monitor which affiliate promotions drive the most revenue
Engagement Tracking:
- How to track links and button clicks in WordPress – See exactly which CTAs and links your visitors interact with most
- How to set up download tracking in WordPress – Monitor PDF downloads, ebooks, and digital product interest
Form and Conversion Tracking:
- Complete guide to WordPress form tracking – Track every form submission across your entire site
- How to track the user journey after form submission – See what happens after visitors complete your contact forms
These guides give you complete visibility into every aspect of your WordPress site’s performance.
Combined with cart abandonment tracking, you’ll have all the data needed to make confident, revenue-boosting decisions.

Comments Leave a Reply